Visual Behavior - Optical Physiology
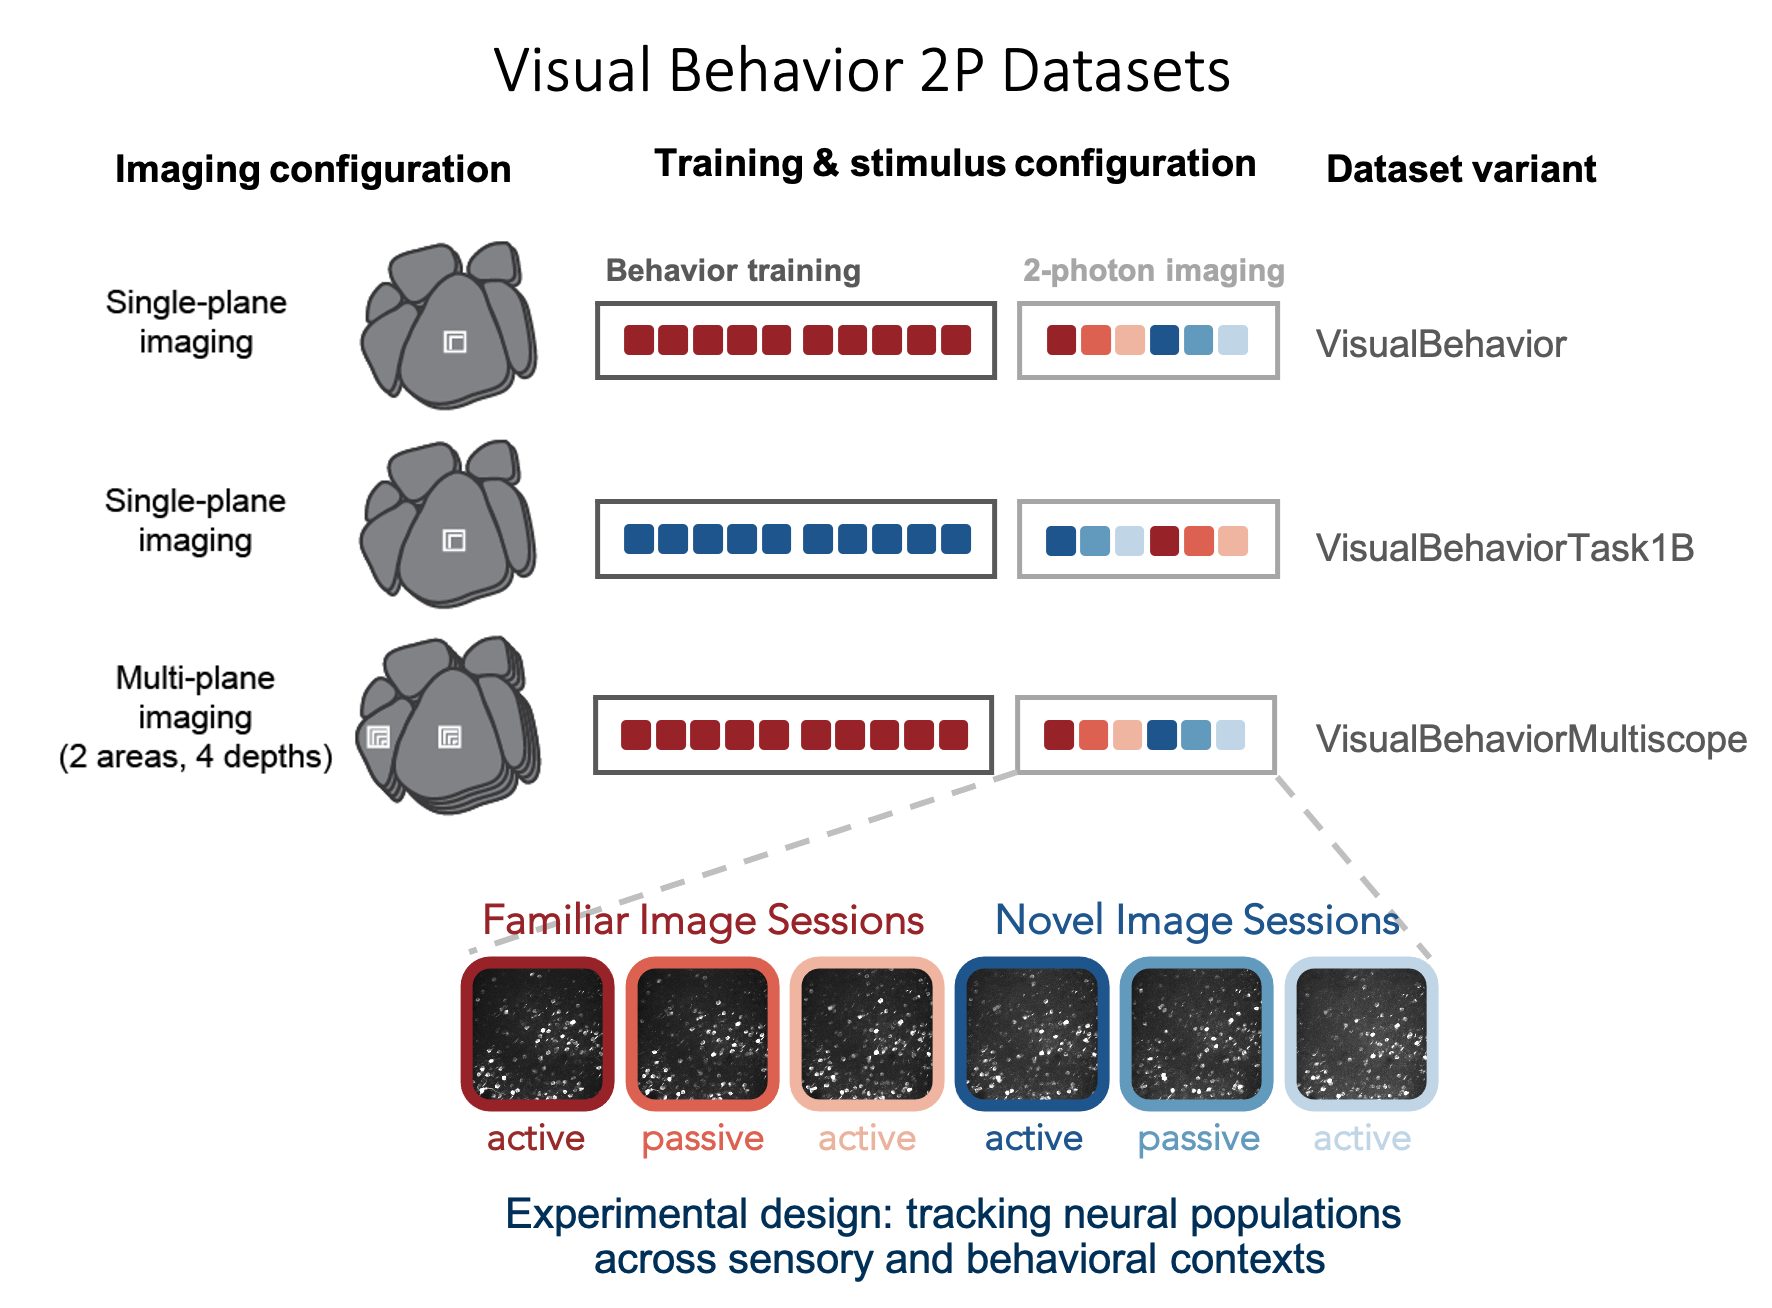
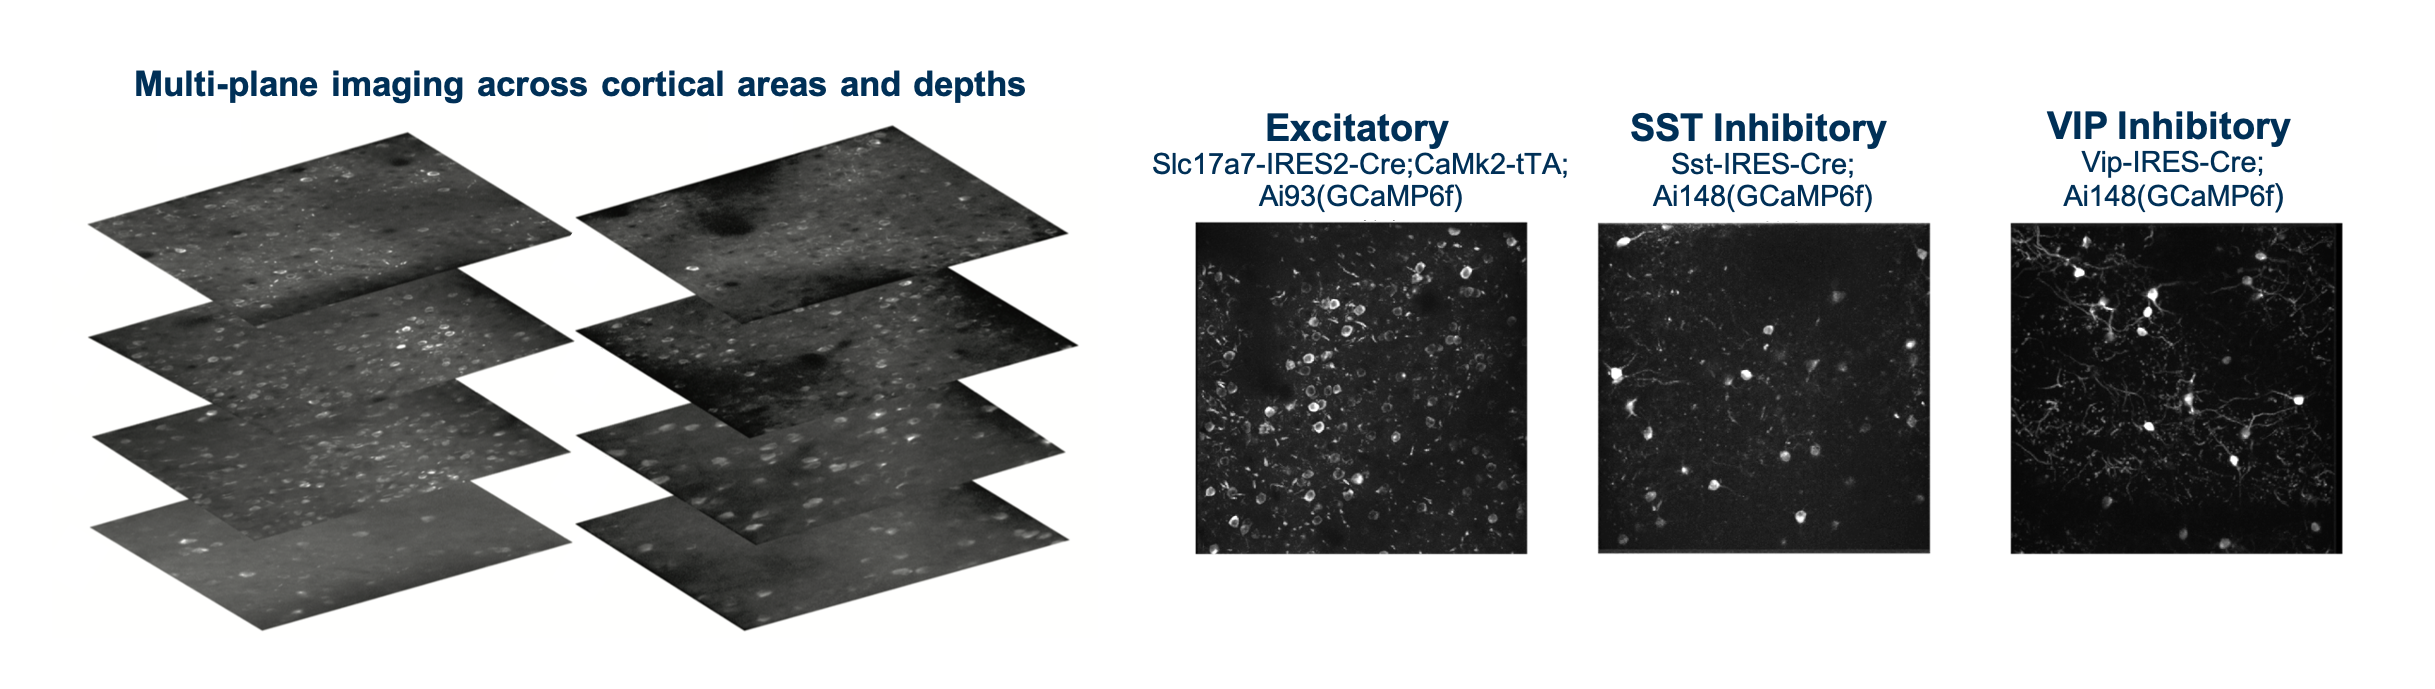
The Visual Behavior 2P project used in vivo 2-photon calcium imaging (also called optical physiology, or “ophys”) to measure the activity of populations of genetically identified neurons in the visual cortex of mice performing a visually guided behavioral task (described below). We used single- and multi-plane imaging approaches to record the activity of populations of excitatory neurons and two inhibitory classes, Somatostatin (Sst) and Vasoactive Intestinal Peptide (Vip) expressing interneurons, across multiple cortical depths and visual areas. Each population of neurons was imaged repeatedly over multiple days under different sensory and behavioral contexts, including familiar and novel stimuli, as well as active behavior and passive viewing conditions. This dataset can be used to evaluate the influence of experience, expectation, and task engagement on neural coding and dynamics.
While 2-photon imaging data was acquired in well-trained mice, the full behavioral training history of all imaged mice is also provided, allowing investigation into task learning, behavioral strategy, and inter-animal variability.
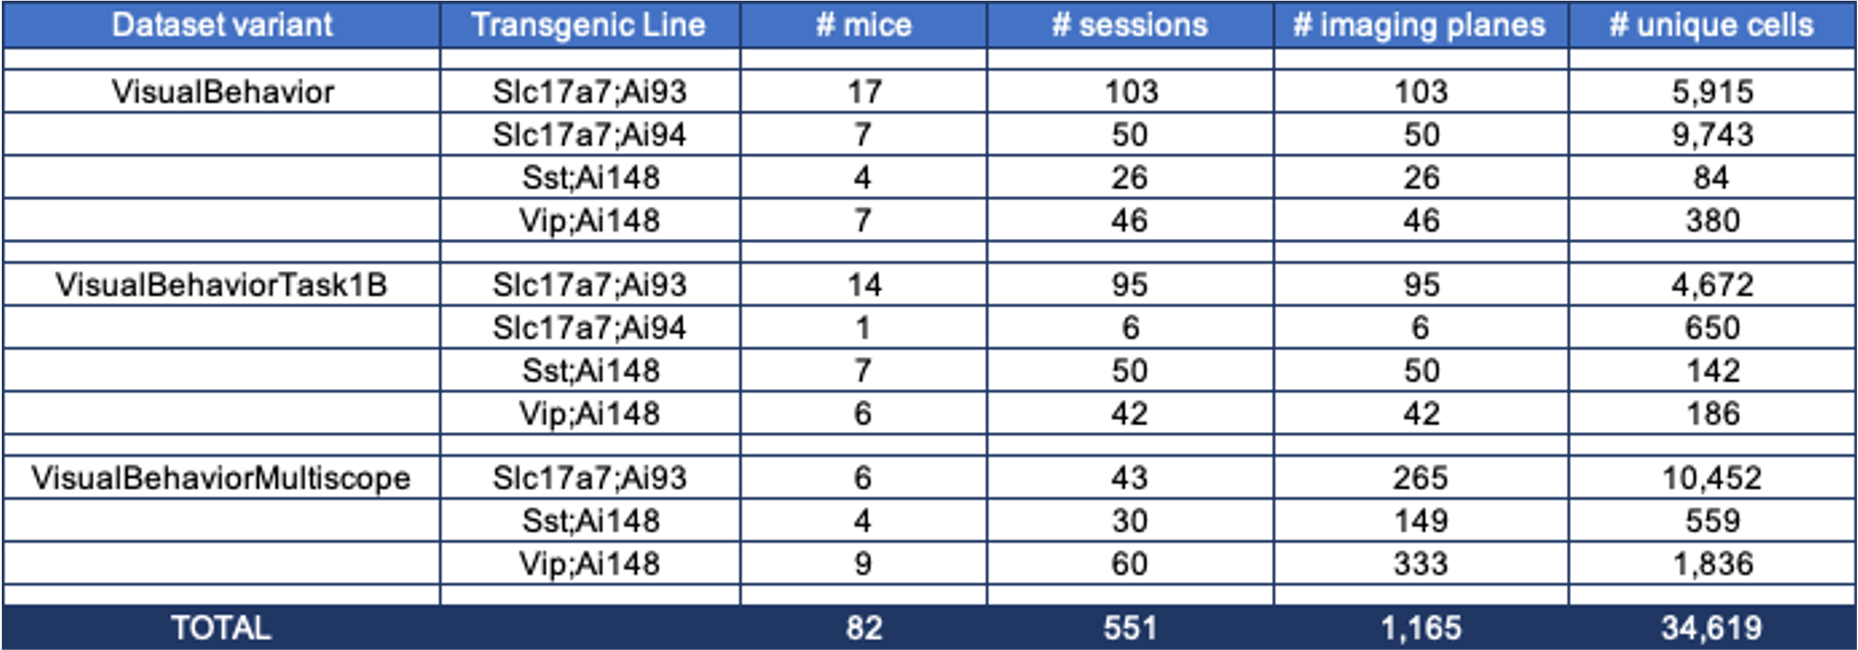
Overall, the dataset includes neural and behavioral measurements from 82 mice, including 3021 behavior training sessions and 551 in vivo 2-photon imaging sessions, resulting in longitudinal recordings from 34,619 cortical cells.
The table below describes the numbers of mice, sessions, and unique recorded neurons for each transgenic line and imaging platform in the dataset:
GETTING STARTED
First, install or update the AllenSDK, our Python based toolkit for accessing and working with Allen Institute datasets.
Data is provided in in NWB format and can be downloaded using the AllenSDK, or accessed directly via this S3 bucket. Regardless of which method of file download you choose, we recommend that you load and interact with the data using the tools provided in the AllenSDK, which have been designed to simplify data access and subsequent analysis. No knowledge of the NWB file format is required.
Specific information about how Visual Behavior Optical Physiology data is stored in NWB files and how AllenSDK accesses NWB files can be found: here.
To get started, check out these jupyter notebooks to learn how to:
- Download data using the AllenSDK or directly from our Amazon S3 bucket (download .ipynb)
- Identify experiments of interest using the dataset manifest (download .ipynb)
- Load and visualize data from a 2-photon imaging experiment (download .ipynb)
- Examine the full training history of one mouse (download .ipynb)
- Compare behavior and neural activity across different trial types in the task (download .ipynb)
For a quick summary of experimental design and data access, see the further documentation.
For detailed information about the experimental design, data acquisition, and informatics methods, please refer to our technical whitepaper. If you have questions about the dataset that aren’t addressed by the whitepaper or any of our tutorials, please reach out by posting at https://community.brain-map.org/
CHANGE DETECTION TASK
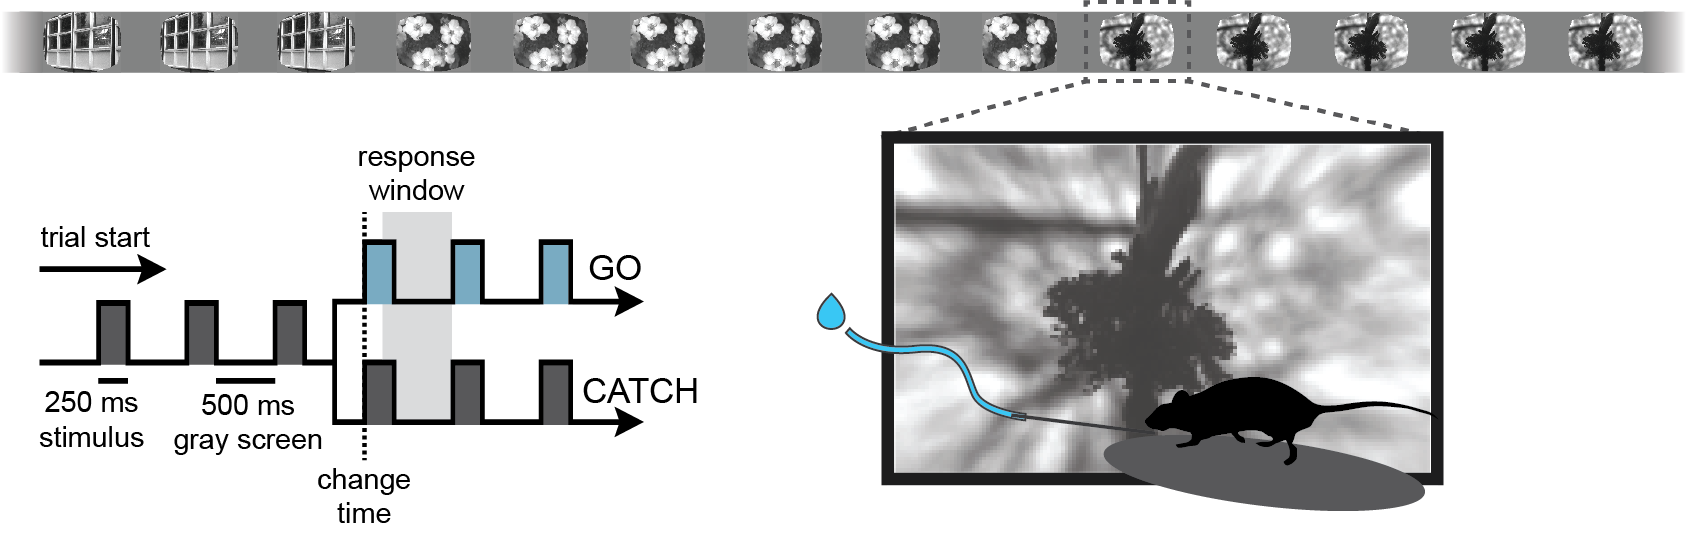
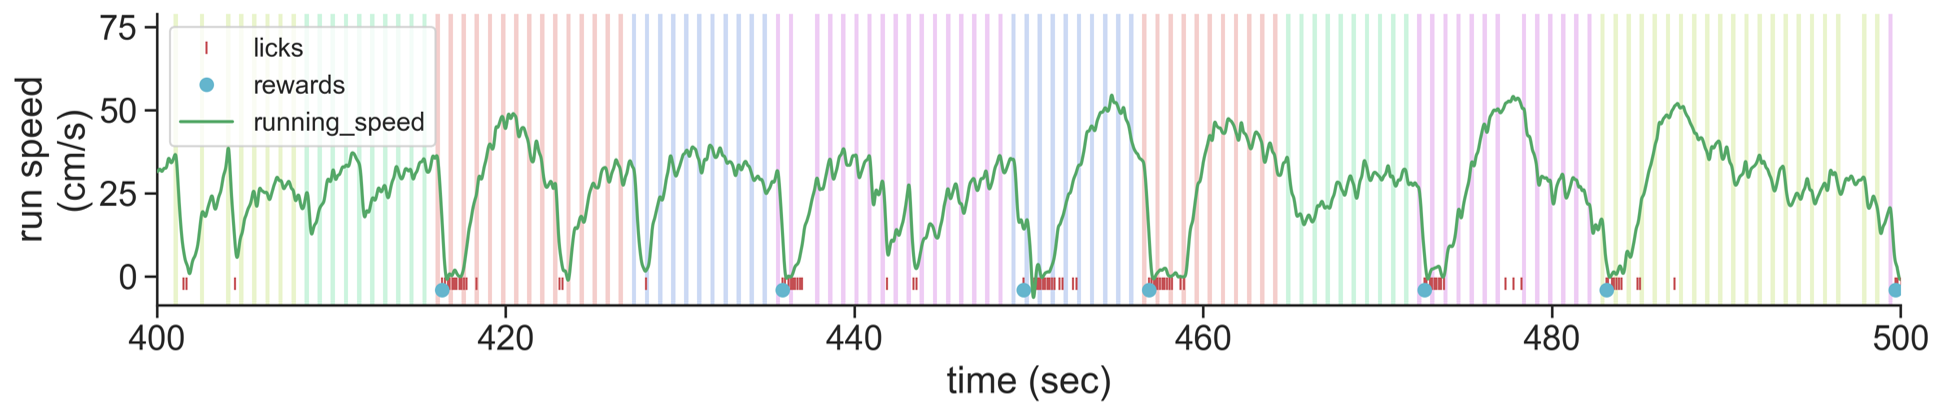
We trained mice to perform a go/no-go visual change detection task in which they learned to lick a spout in response to changes in stimulus identity to earn a water reward. Visual stimuli are continuously presented over a 1-hour session, with no explicit cue to indicate the start of a trial. Mice are free to run on a circular disk during the session.
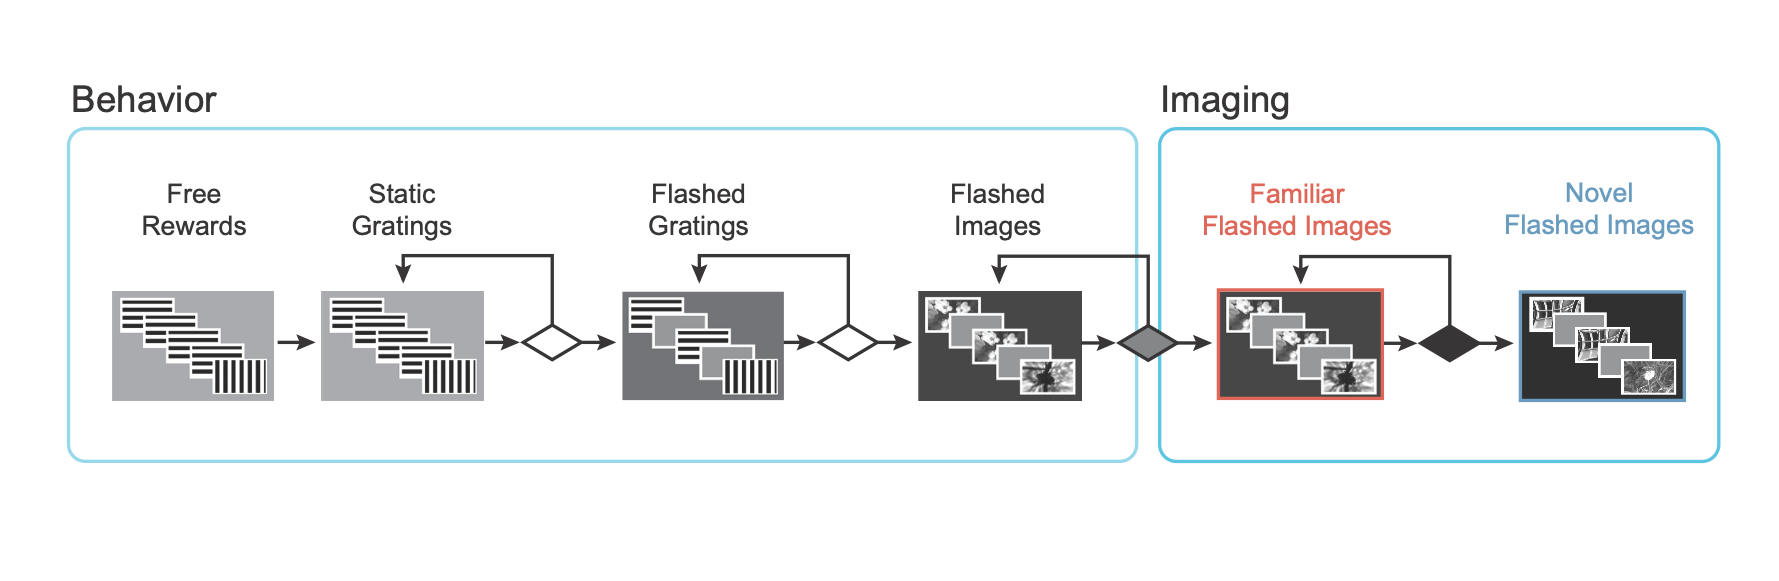
We used a standardized procedure to progress mice through a series of training stages, with transitions between stages determined by specific advancement criteria. First, mice learned to detect changes in the orientation of full field static grating stimuli. Next, a 500ms inter stimulus interval period with mean luminance gray screen was added between the 250ms stimulus presentations, incorporating a short-term memory component to the task. Once mice successfully and consistently performed the orientation change detection with flashed gratings, they moved to the image change detection version of the task. During image change detection, 8 natural scene images were presented during each behavioral session, for a total of 64 possible image transitions. When behavioral performance again reached criterion, mice were transitioned to the 2-photon imaging stage in which they performed the task under a microscope to allow simultaneous measurement of neural activity and behavior.
Behavioral training data for mice progressing through these
stages of task learning is accessible via the BehaviorSession
class of the AllenSDK or the get_behavior_session() method of
the VisualBehaviorOphysProjectCache. Each BehaviorSession
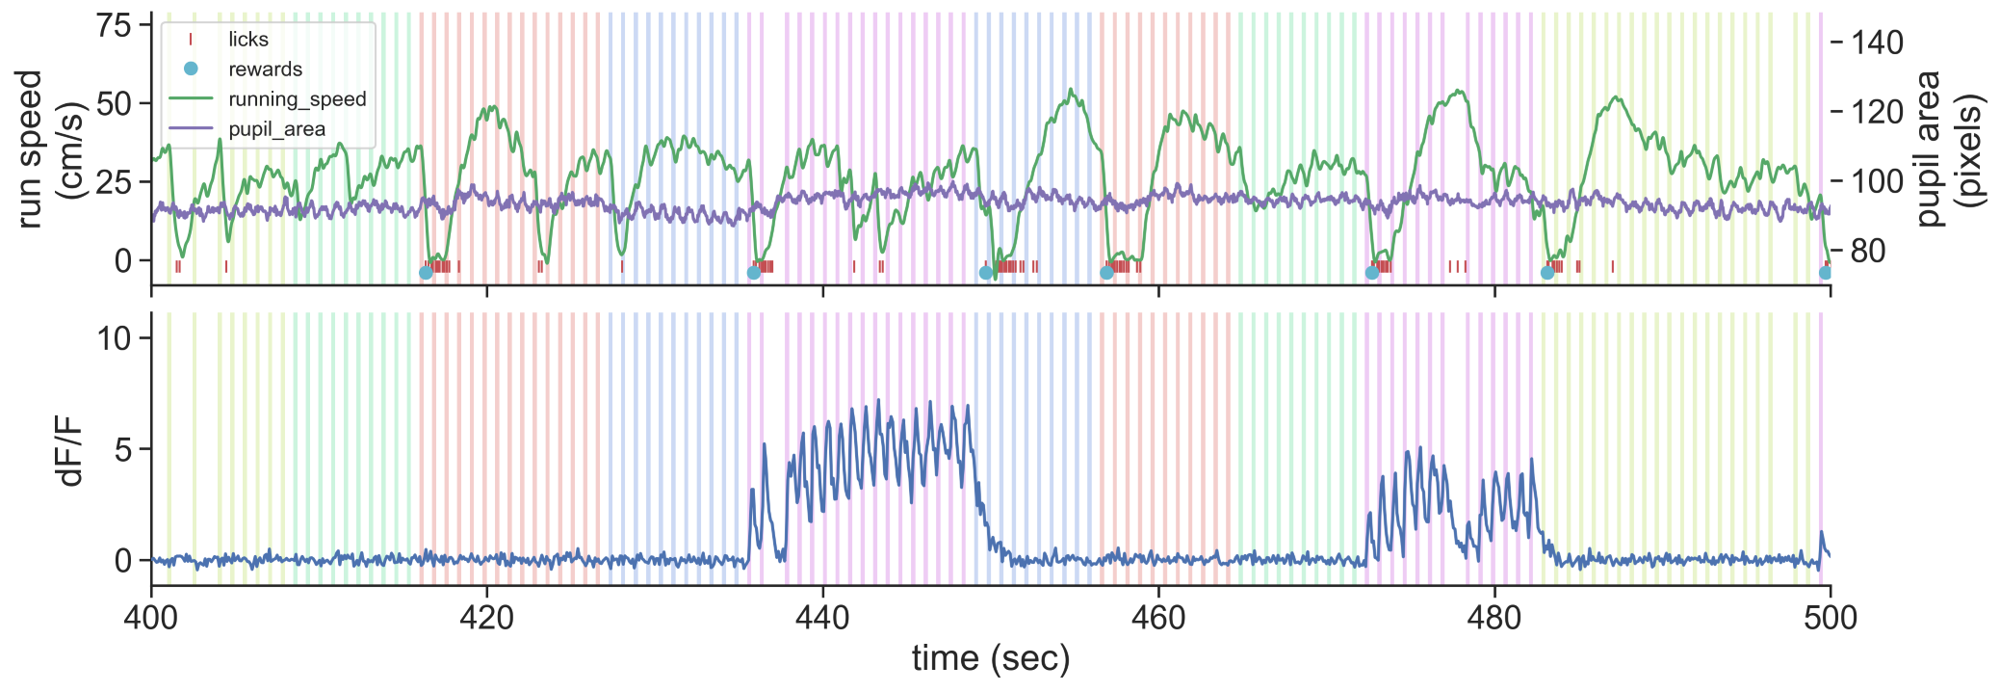
contains the following data streams, event times, and metadata:
- Running speed
- Lick times
- Reward times
- Stimulus presentations
- Behavioral trial information
- Mouse metadata (age, sex, genotype, etc)
2-PHOTON IMAGING DATASET
Once mice are well-trained on the image change detection task, they transition to performing the behavior under a 2-photon microscope. During the imaging phase, mice undergo multiple session types, allowing measurement of neural activity across different sensory and behavioral contexts.
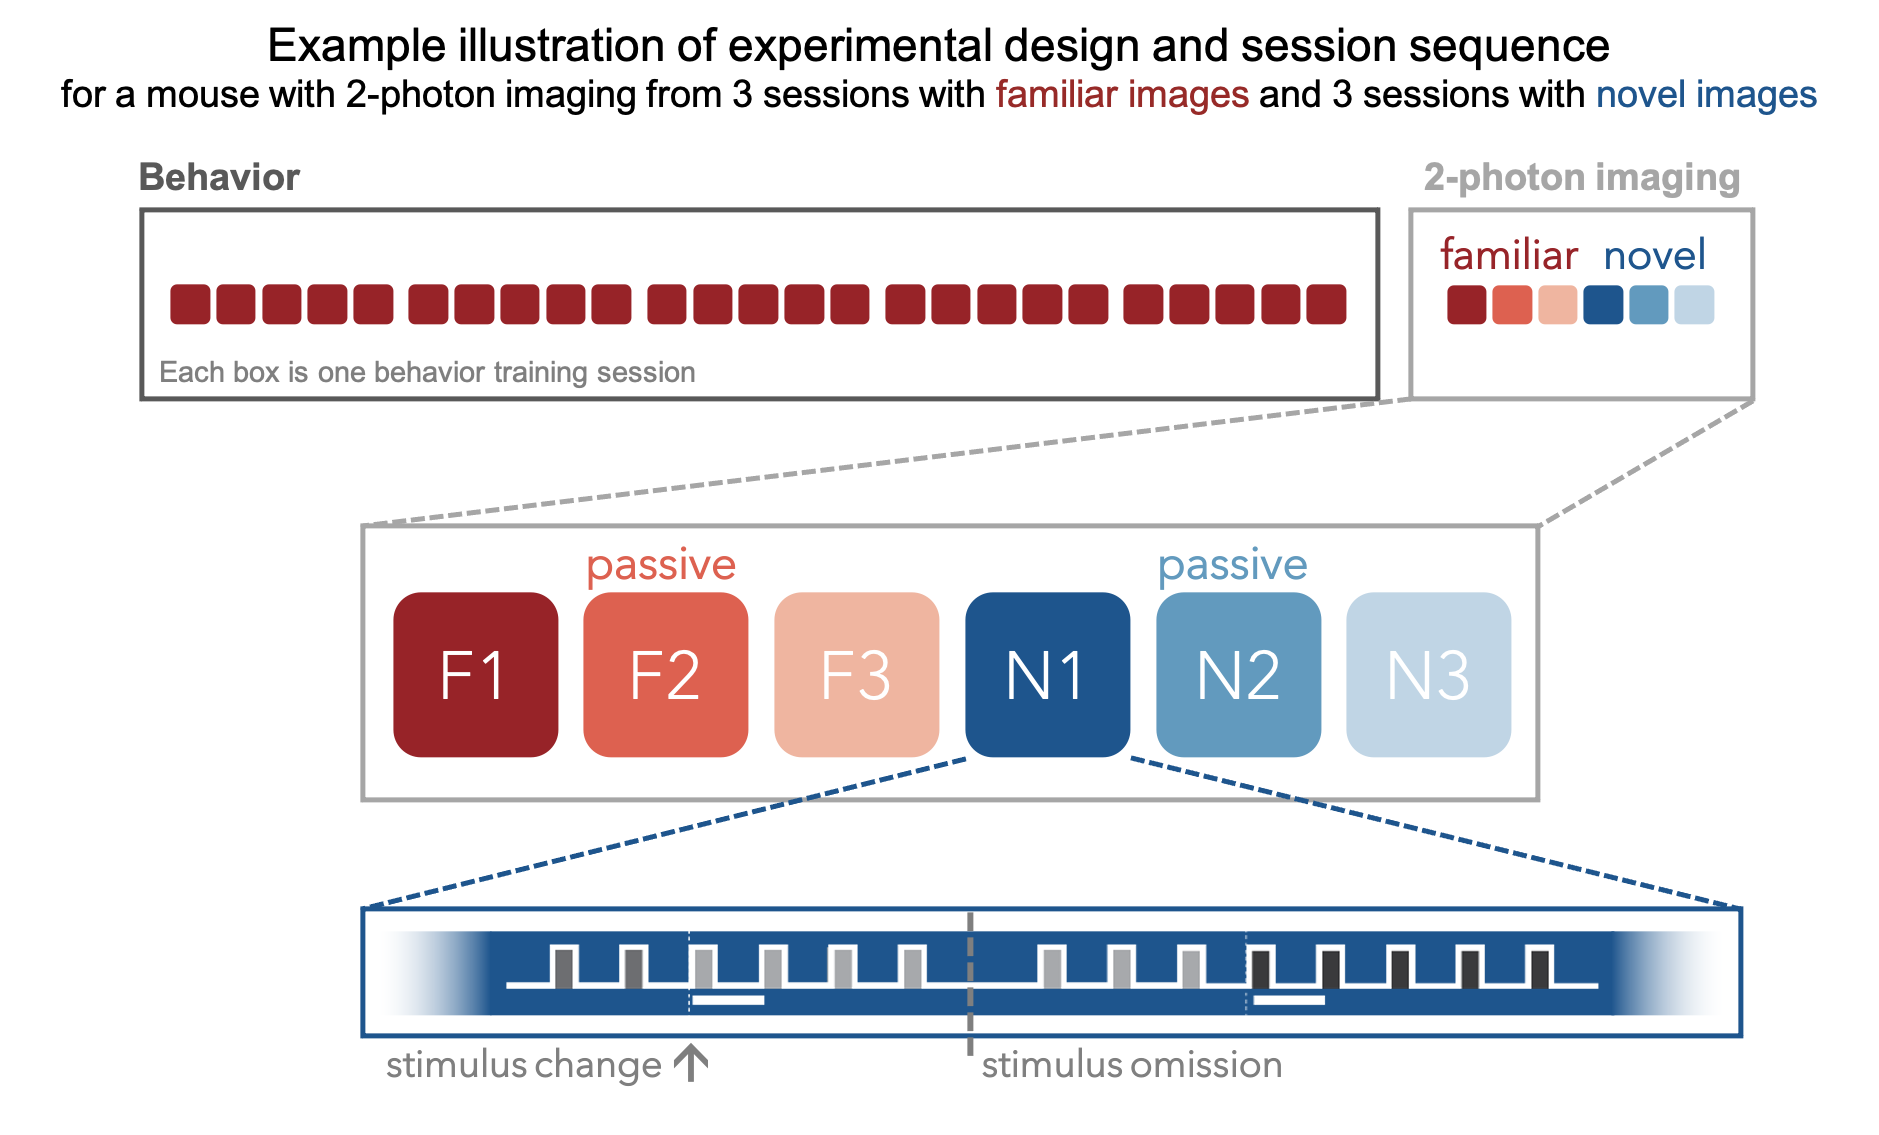
Mice initially perform the task under the microscope with the same set of images they observed during training, which have become highly familiar (each image is viewed thousands of times during training). Mice also undergo several sessions with a novel image set that they had not seen prior to the 2-photon imaging portion of the experiment. Interleaved between active behavior sessions, are passive viewing sessions where the mice are given their daily water before the session (and are thus satiated) and view the task stimuli with the lick spout retracted so they are unable to earn water rewards. This allows investigation of the impact of motivation and attention on patterns of neural activity. Finally, stimuli were randomly omitted with a 5% probability, resulting in an extended gray screen period between two presentations of the same stimulus, and disrupting the expected cadence of stimulus presentations. Stimuli were only omitted during the 2-photon imaging sessions (not during training), and change stimuli were never omitted.
We used both single- and multi-plane 2-photon imaging to record the activity of GCaMP6 expressing cells in populations of excitatory (Slc17a7-IRES2-Cre;Camk2a-tTA;Ai93(TITL-GCaMP6)) and inhibitory (Vip-IRES-Cre;Ai148(TIT2L-GC6f-ICL-tTA2) & Sst-IRES-Cre;Ai148(TIT2L-GC6f-ICL-tTA2)) neurons. Imaging took place between 75-400um below the cortical surface.
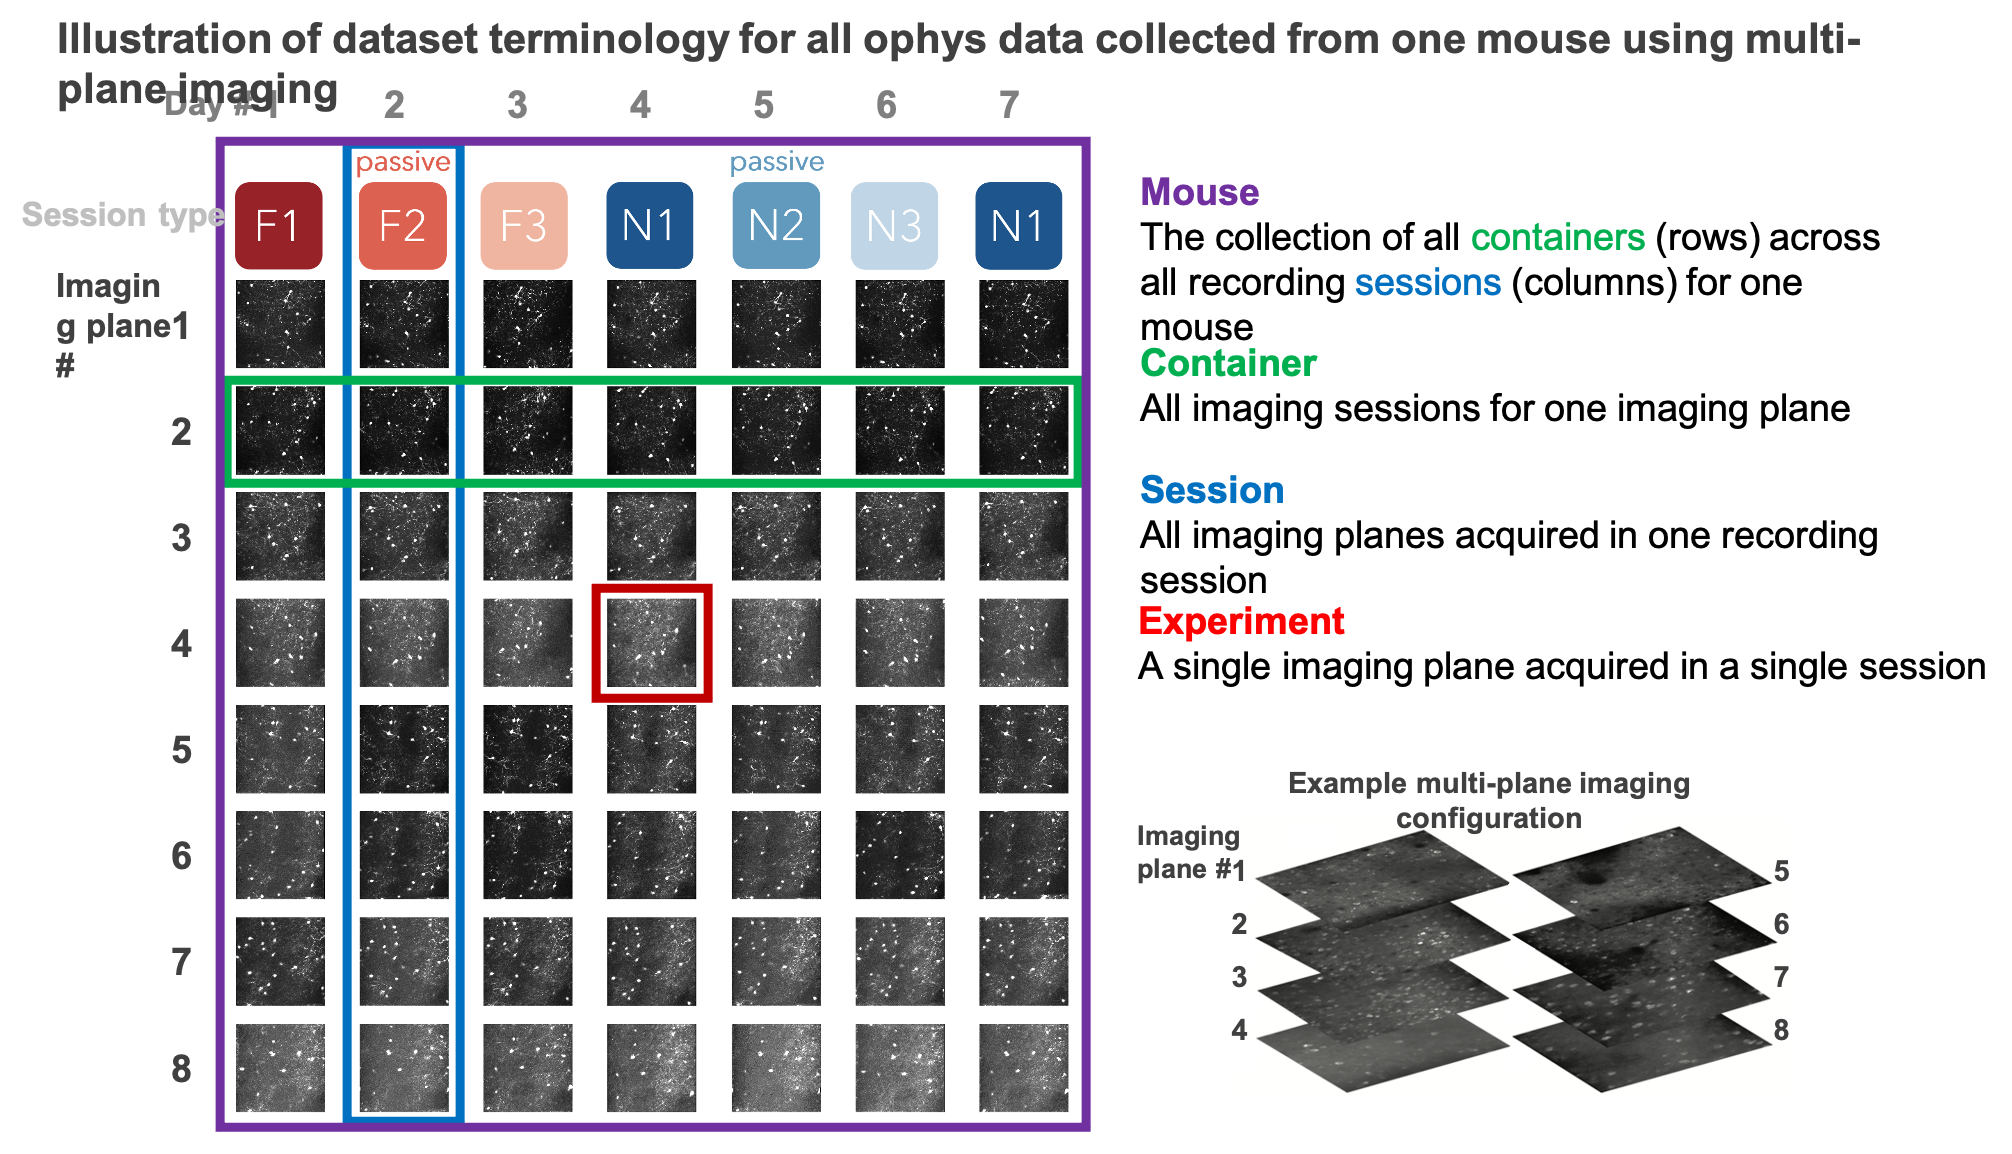
The data collected in a single continuous recording is defined as a session. For single-plane imaging experiments, there is only one imaging plane (referred to as an experiment) per session. For multi-plane imaging experiments, there can be up to 8 imaging planes (aka 8 experiments) per session. Due to our strict QC process, described below, not all multi-plane imaging sessions have exactly 8 experiments, as some imaging planes did not meet our data quality criteria.
We aimed to track the activity of single neurons across the session types described above by targeting the same population of neurons over multiple recording sessions, with only one session recorded per day for a given mouse. The collection of imaging sessions for a given population of cells, belonging to a single imaging plane measured across days, is called a container. A container can include between 3 and 11 separate sessions for a given imaging plane. Mice imaged with the multi-plane 2-photon microscope can have multiple containers, one for each imaging plane recorded across multiple sessions. The session types available for a given container can vary, due to our selection criteria to ensure data quality (described below).
Thus, each mouse can have one or more containers, each representing a unique imaging plane (experiment) that has been targeted across multiple recording sessions, under different behavioral and sensory conditions (session types).
The BehaviorOphysExperiment class in the AllenSDK (or the
get_behavior_ophys_experiment() method of the
VisualBehaviorOphysProjectCache) provides all data for a
single imaging plane, recorded in a single session, and contains
the following data streams in addition to the behavioral data
described above:
- Max intensity image
- Average intensity image
- Segmentation masks
- dF/F traces (baseline corrected, normalized fluorescence traces)
- Corrected fluorescence traces (neuropil subtracted and demixed, but not normalized)
- Events (detected with an L0 event detection algorithm)
- Pupil position
- Pupil area
DATA PROCESSING
Each 2-photon movie is processed through a series of steps to obtain single cell traces of baseline-corrected fluorescence (dF/F) and extracted events, that are packaged into NWB files along with stimulus and behavioral information, as well as other metadata.
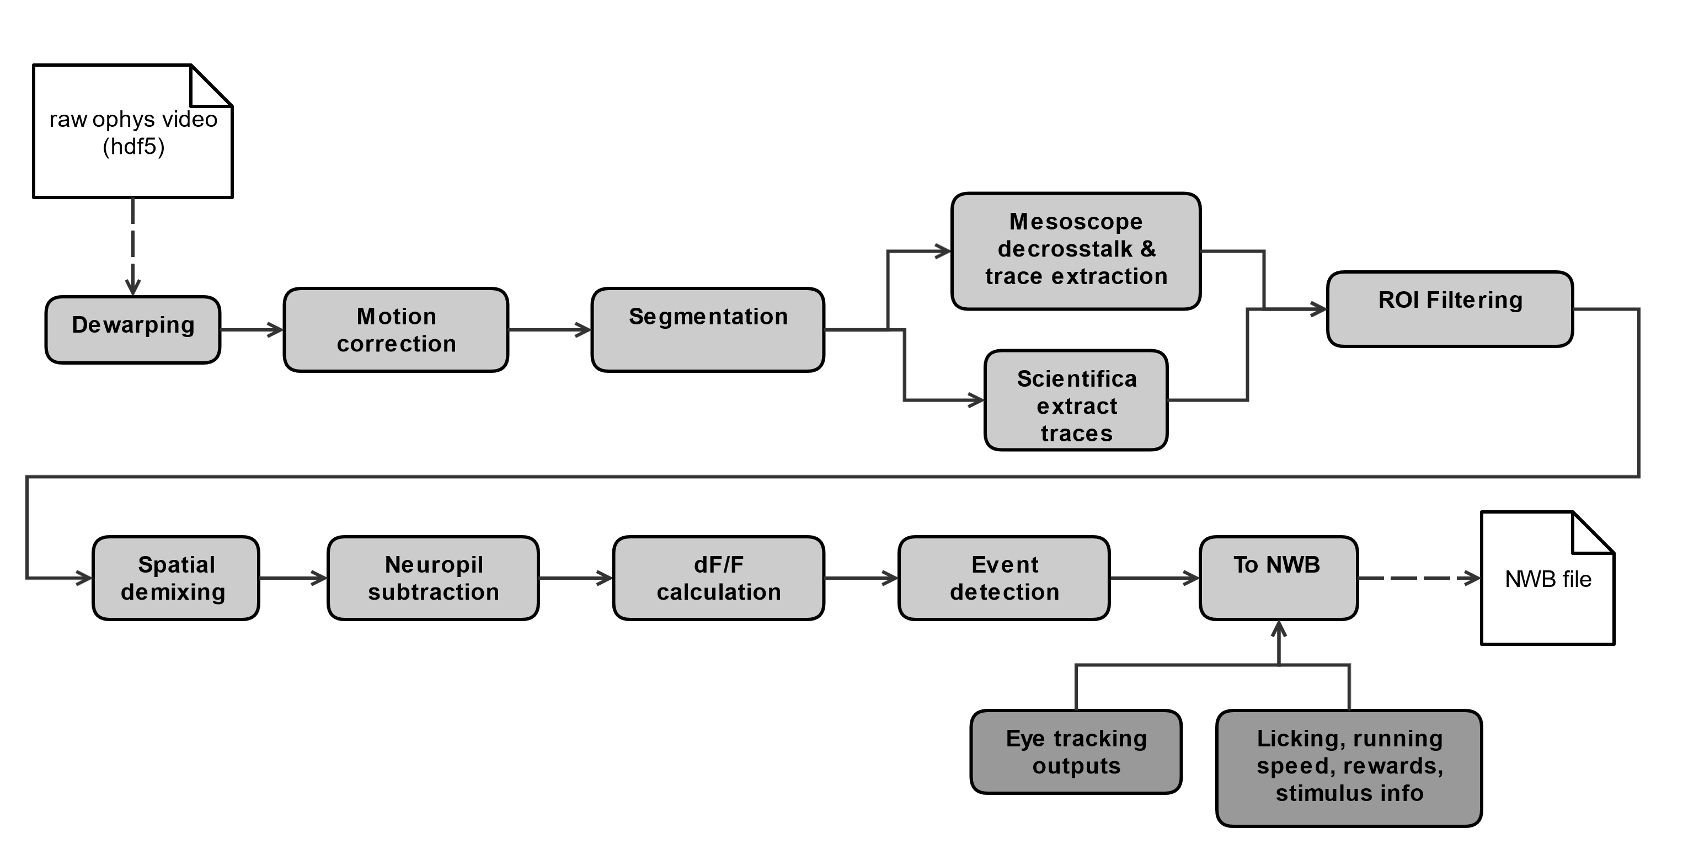
Detailed descriptions of data processing steps can be found in the technical white paper, as well as our data processing repository.
QUALITY CONTROL
Every 2-photon imaging session was carefully evaluated for a variety of quality control criteria to ensure that the final dataset is of the highest quality possible. Sessions or imaging planes that do not meet our criteria are excluded from the dataset in this release. These are a few of the key aspects of the data that are evaluated:
- intensity drift
- image saturation or bleaching
- z-drift over the course of a session
- accuracy of session-to-session field of view matching
- excessive or uncorrectable motion in the image
- uncorrectable crosstalk between simultaneously recorded multiscope planes
- errors affecting temporal alignment of data streams
- hardware or software failures
- brain health
- animal stress
SUMMARY OF AVAILABLE DATA
| Behavior | Physiology | Metadata |
|---|---|---|
| Running speed | Max intensity projection image | Mouse genotype, age, sex |
| Licks | Average projection image | Date of acquisition |
| Rewards | Segmentation mask image | Imaging parameters |
| Pupil area | Cell specimen table | Task parameters |
| Pupil position | Cell ROI masks | Session type |
| Stimulus presentations table | Corrected fluorescence traces | Stimulus images |
| Trials table | dF/F activity traces | Performance metrics |
| Stimulus timestamps | Detected events | |
| Ophys timestamps |